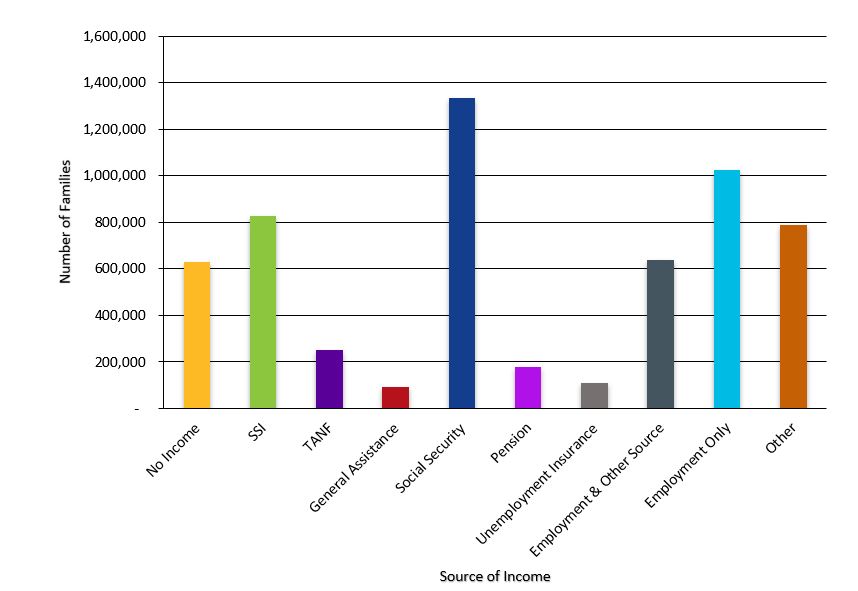
Families served by CSBG have the ability to report all sources of income, not just the primary source to CAAs. It is critical to note that 14.5 percent of the families who reported income to CAAs, approximately 629,669 of those families, reported zero income in FFY 2017. This is an increase of nearly 13,000 families reporting no income from FFY 2016. While most families report having a source of income, this increase in families with no income underscores the ups and downs that families with low incomes face in making ends meet. Low-income households experience significantly greater instability in their monthly incomes than high-income households. Income can come from a combination of wages, government assistance, social security, pension, and other types of resources. The following statistics outline key income trends of families in the CSBG Network who reported one or more sources of income:
- 14.5 percent of families reported zero income
- Over 47.7 percent of participant families who reported one or more sources of income indicated that some or all their income came from employment.
- Approximately 89 percent of participant families included a worker, an unemployed job-seeker, or a retired worker as contributing to their income sources.
- Over 1 million low-wage participant families relied solely on their wages for income.
- CAAs served over 1.5 million families living on retirement income from Social Security or pensions.
- Temporary Assistance for Needy Families (TANF) provided income to less than seven percent of the families served by CAAs.
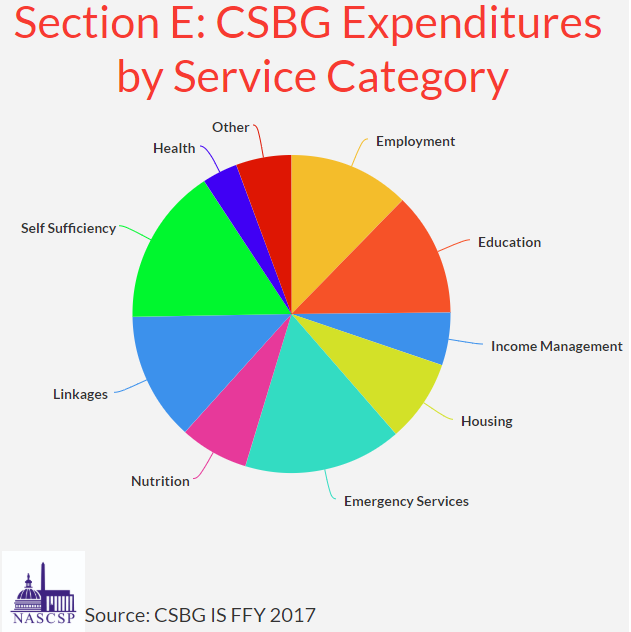
Sources of Income for FFY 2017 CAA Program Participant Families
- $79,593,401.14 in Employment
- $81,278,116.85 in Education
- $34,688,778.70 in Income Management
- $54,265,359.10 in Housing
- $104,171,314.12 in Emergency Services
- $45,256,837.42 in Nutrition
- $84,322,324.60 in Linkages
- $103,722,355.95 in Self Sufficiency
- $23,373,042.73 in Health
- $36,541,684.61 in Other