by Tabitha Beck
As the fight to keep CSBG at an adequate funding level continues, NASCSP wants to be sure our members and supporters have the most up-to-date information regarding the success of CSBG. In mid-September, all CSBG members received the 2010 CSBG Annual Report and Highlights via mail. We also sent them to State CAA Associations, partners, governors, and key legislators.
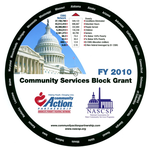
A new tool offered this year is the CSBG Data Wheel! Those of you who attended the NASCSP Fall Conference in Seattle already received a copy. We will be sending them out to members who did not make the conference. The Community Action Partnership collaborated with NASCSP on this project and is also distributing them far and wide to help demonstrate the success of CSBG.
There are 26 States on each side of the wheel. You can spin the outside disk to show each State’s data in the window and compare it to the national CSBG Network data on the left side of the window. The sections referenced below are from the CSBG IS Survey.
- Poverty Conditions Eliminated: the total conditions of poverty reduced or eliminated in your state. This number is calculated by adding up the “achieved” columns from all NPIs except for 2.2, 2.3B, 2.4, 3.1, 4.1, 5.1, 6.5. Note that this number represents conditions of poverty, not unduplicated individuals.
- Volunteer Hours: the total volunteer hours reported in NPI 2.3B in your State.
- People Served: the total unduplicated people in your State, reported in Section G, items 3 and 4.
- Children: the total number of children up through age 17 in your State, as reported in Section G, Item 8.a-c.
- Seniors: the total number of seniors age 55+ in your State, as reported in Section G, Item 8.g-h.
- % Below 100% Poverty: of all the families reported in Section G Item 15 in your State, the percent reported in Item 15.a-c, up to 100% of the Federal Poverty Guideline.
- % Below 50% Poverty: of all the families reported in Section G Item 15 in your State, the percent reported in Item 15.a, up to 50% of the Federal Poverty Guideline.
- $ CSBG Allocation (million): your State’s FY11 CSBG allocation, as listed on the OCS website.
- $ Non-federal leveraged by $1 CSBG: from Section F, the total from the State, Local, and Private allocation amounts, divided by the CSBG allocation listed in Section F, Item 2.a.
If you have any questions, or would like some extra copies to distribute to legislators or other key partners in your State, please email Tabitha Beck at tbeck@nascsp.org. We have a limited supply of extra wheels, but we do want them used by the Network. Also, if you are interested in creating a State version with your agencies’ data, you can contact me to discuss.
As always, any feedback on this or any other NASCSP resources is welcome. We want to be sure we are producing tools that are useful.


